|
GROSS
DOMESTIC PRODUCT
|
|
by Valentino Piana (2001) |
|
|
|
||
|
Contents |
||
| 7. Beyond GDP: the proposal of the Quality Domestic Product and its nowcasting | ||
|
|
||
|
Significance As a measure of well-being of a country for international and temporal comparisons, it provides a good first approximation. Still, it ignores many crucial elements of general well-being, like environment conservation, safety, life expectance, and population literacy. In this respect, one should rather look at the Human Development Index. Composition
A
numerical example will explain the fact that GDP is expressive of these
three sides or, in other words, of the contemporary action of buyers,
sellers, producers and the income receivers.
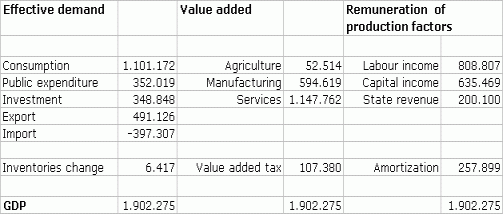
In
the first column, attention is given to the buyers. GDP is then measured
as the sum of all domestic and foreign effective demand for national goods.
Domestic demand is the sum of household, government, and firm expenditure
(respectively called: consumption, public
expenditure, and investment). Foreigners
buy national goods as exports. Domestic demand is
attracted not only by national goods but also by imports,
which reduce the GDP sum. A minuscule additional element is the change
in inventories (the goods that nobody wants at the moment). The second column
shows the position of the sellers and the kind of things they sell: GDP
is now obtained by summing up "value added" over the economic
branches of the economy. VAT revenue is added to obtain GDP. The third column points
at the remuneration of production factors (labour and capital) with the
share of the state. The same income serves as source of finance for the
demand of the first column. This identity expenditure = output = income holds always as a matter of definition and national accountancy conventions [2]. Indeed, a fourth relationship
holds: employment times
labour productivity equal GDP. It's a tautology because there is no
other way to compute the (macro) labour productivity than dividing GDP
by employment. Productivity at this level has no autonomous meaning, cannot
be considered constant or subject to a specific dynamics. At individual
product level, a process innovation without changes in sale price and
quantities may well reduce employment, e.g. thanks to a faster machine.
However there are too heterogeneities and feedback loops for an identifiable
autonomy of productivity. Determinants The diffusion of technological and organizational innovation can impact on productivity, on product/process quality and on costs (thus potentially on value added). Capital accumulation and the increase of labour quality and motivation are important ingredients for a growing GDP. Short term business cycles and long term trends can be - to a certain extent - traced back to the individual growth path of heterogeneous firms, as this paper points out. GDP can manifest manyfold interactions with its components, giving rise to positive and negative loops. One of the most important is the link between consumption and income. Other feedback loops are included in this interactive map. Movements in GDP have a number of effects on specific markets. For instance, energy consumption and greenhouse gases' emissions can be linked to it, unless proper strategies are undertaken.
Never is GDP at the same level year after year. The most common GDP trend
is a continuous growth with periods of acceleration and deceleration.
Some episodes of absolute fall are afterwards overwhelmed by further growth.
Decades can be quite different in terms of average rate of GDP growth. In many countries, especially small and in the Third World, growth is hectic and irregular, with frequent and deep absolute falls and booms. Wars are a distinctive source of GDP sinking. Oil crises have exerted recessionary pressure all over the world (with the partial exception of oil producer countries). On a global scale, the distance between the richest and the poorest countries is increasing, whereas locally there exist "convergence clubs" in which distances are getting smaller. A few developing countries have taken off and reached a high development stage.
Business
cycle behaviour Growth in GDP is particularly pronounced during expansionary and booming phases, culminating in peaks, which open the gates towards recession or even depression. They last until a trough is reached, often thanks to specific policies and favourable international conditions, which is followed by recovery, when the losses cumulated are reverted back. How can a country increase output value in short run? Well, many fiscal, monetary, industrial policies have been adopted to this end, as you can explore here. Beyond GDP: the proposal of the Quality Domestic Product and its nowcasting The GDP has a number of evident limitation as main indicator for economic policies. Our institute is on the forefront of the research on alternatives. The EWI has not only been quoted as a reference source by the EU Parliament Background Report on "Beyond GDP - Alternative progress indicators to Gross Domestic Product (GDP) as a means towards sustainable development", and assured the presence to the starting conference, but has participated, in the person of his director, to the reflections, building blocks, formulas, simplifications and empirical estimation of the Quality Domestic Product - the share of GDP which is of "good quality" (according to a multi-criteria definition), carried out by the Scientific Commitee on behalf of the Italian Foundation "Symbola". This work, which is on-going across the years, produced in 2007 this report [in Italian language] and can lead to industrial, territorial and other policies to improve the composition of GDP in mature and developing countries. In 2014 we published here a nowcasting technique for the Quality Domestic Product. Please
feel free to contact us for further details
and possible cooperation. Data GDP
data from 136 countries: a long term time series GDP
dynamics (1969-2009) - 192 countries Data
for all the variables in IS-LM model Formal
models Recent GDP figures all over the world
[1] Some simplifications apply. Data source: ISTAT. [2] Looking
at the same transaction two identities hold: The quantity sold is always
equal to the quantity bought. Money spent is always
equal to money obtained. I buy an apple. The seller has sold an apple. I've spent a dollar. He has got a dollar. Even if I don't like apples or I think that a dollar is too much for an apple. |
||
|
Download in just one click all key concepts and the entire website [2014] compressed [450 MB] Please be patient - it may take long but it's worth downloading! |
||